Extended Event File Target size vs SQL Server Trace trace file – a comparison
No big science, more out of curiosity this time..
The Extended Events File Target for SQL Server saves data using xml, which as is well known, is a bit “chatty”. A student in my recent SQL Server Master-Class workshop on extended events came up with the question for how much (more) space he would have to account for using Extended Events with a file target. Although this depends greatly on the specific events and possibly actions, selected, I was a bit curious myself and decided for a small test.
Both, the old and deprecated SQL Server Trace and Extended Events can save the data in a file, so it’s easy to compare what difference in size the new format will make.
I set up a SQL Server Trace that is almost identical to an Extended Events Trace. (You will see why “almost”.)
I had to choose a very simple Trace, so the customizable columns of extended events would not make the comparison unequal and ended up with a trace that captures SP:Starting/SP:Completed with the following columns:

You will see why I collect Source/DatabaseID twice later on. Of course I used a lightweight Server-Trace, although for the purpose of this comparison it would not have mattered.
The SQL Trace Definition:
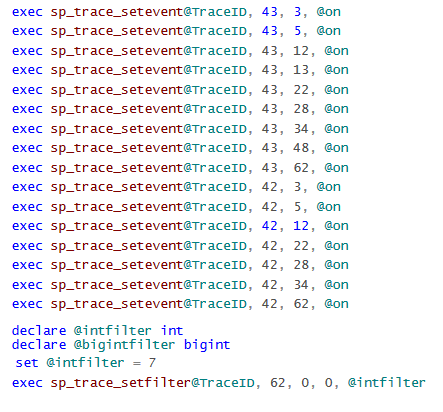
As you might see the trace includes a filter, which is for a specific database ID.
The Extended Event Trace session looks like that:
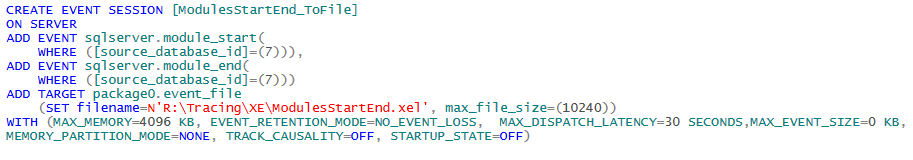
You may know, that Extended Events include certain columns by default, and for module_start/end, this includes offset and offset_end.

Those two columns are not available for SP_Staring/SP:Completed in SQL Trace. Since they are both integers, I decided to include another column, DatabaseID, into the SQLTrace. SQL Trace also includes the SPID by default, which cannot be deselected, therefore those two columns should equalize it. Both traces were started before the workload which ran for a while. At the end, the same number of events have been logged by both technologies in parallel.
SQL Trace event count:
![]()
XEvent Trace event count:
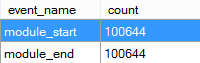
100644 + 100644 = 201288, so both captured the exact same events. 🙂
So, and now to the final question: what size are the files?
See yourself:
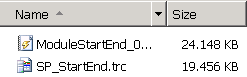
Size in Megabytes:
![]()
(The numbers in MB are the real size, whereas windows explorer shows the size on disk.)
That’s a difference of 5.32MB or in other words 29.13%.
And this is what one single module_start-event for a function call in XEvents looks like:

The content is self-explanatory, as xml is supposed to be, and the overhead in size is no surprise at all.
Keep in mind that this post is purely on comparing file sizes, and not performance or features. There are good reasons that SQL Trace & Profiler have been deprecated, and Extended Events in SQL Server 2012 overcomes SQL Trace & Profiler by far, in performance as well as in flexibility/usability. For a performance overhead comparison check out my recently published benchmark blog post: “Performance overhead of tracing with Extended Event targets vs SQL Trace under CPU Load“.
So whenever performance matters, remember to set session options appropriately and if the amount of events is high, do not use your slowest volume for the file target – same as for all other tracing activities anyways.
happy tracing,
Andreas

Leave a Reply
Want to join the discussion?Feel free to contribute!