Performance overhead of tracing with Extended Event targets vs SQL Trace under CPU Load
Inspired by the Blog Post “Measuring Observer Overhead of SQL Trace vs. Extended Events” by Jonathan Kehayias, I was curious to do some more benchmarking. I have already presented the results in my SQL Server Master-Class workshops on XEvents as well as at the PreCon of the SQLSaturday #230. Now I am finally sharing them with you here.
I was interested in the following aspects, in particular:
- What is the Performance-overhead of an Extended Event Session itself – not including the processing/dispatching for the target
- How does this compare to the old-school SQL Trace – again with no Target overhead (No File, no Profiler: no consumer at all)
Besides that, once I had the setup ready, I decided to include all the other targets and some basic option-variations, to have a complete overview that is comparable in itself.
I also decided for a test of a system that’s already under CPU pressure – so the Processor Usage is almost constantly hitting 100%. Under these circumstances I was hoping to get the maximum impact of Extended Events as well as SQL Trace. (Remember: SQL Profiler is based on SQL Trace) One could think that an I/O driven workload would be even more influenced, but that depends on the targets of Extended Events. – 4 of which only go to memory, vs. one file target (which one should put onto a non-data volume anyways). And since I also want to measure the pure overhead of the tracing technologies (without any target), this makes even more sense. Besides that, I/O usually can be tuned quite easily by writing to an otherwise idle and fast device, whereas for CPU it is not as simple to keep the costs invisible. Keeping this in mind helps to evaluate the results presented here and bringing them into the right context.
Test Environment
“Simple but physical”
1 Windows 2008 R2 Server with SQL Server 2012 SP1. No running services above the minimum required, to avoid side-effects. I also shut down the default trace as well as the system_health_session. The Distributed Replay-client was run locally for all tests, so yes, this has effect on the server, but it was equally for all tests. All tests have been repeated 3 times (some even more) to make sure the average/median is valid. The server, as I already said, was physical (which comes in handy when you are running benchmarks for a total of ~50 hours): 1 Dual Core Intel Xeon with 8 GB of RAM (which was by far enough), Data Volumes and Volumes for Trace-Targets on separate Controllers.
The workload was a mixture of mostly short (sub-second) but also several queries of several second runtime, (Ad Hoc and stored procedures) to simulate a somehow realistic decision-support-systems’ load – no data changes though. The baseline workload took 00:24:24 minutes. The statistics stayed the same for all workloads cycles. The database used was AdventureWorks2012.
Trace-Configurations
I decided for a simple but not uncommon trace that typically collects a lot of data. The trace collects only 2 events:
- Lock acquired
- Lock released
Filtered out: System-sessions and other databases than the one under load here.
CollectedData:
- Lock:Released BinaryData
- Lock:Released DatabaseID
- Lock:Released TransactionID
- Lock:Released SPID
- Lock:Released ObjectID
- Lock:Released Mode
- Lock:Released BigintData1
- Lock:Released IntegerData2
- Lock:Released ObjectID2
- Lock:Released Type
- Lock:Released OwnerID
- Lock:Released IsSystem
- Lock:Acquired BinaryData
- Lock:Acquired DatabaseID
- Lock:Acquired TransactionID
- Lock:Acquired SPID
- Lock:Acquired Duration
- Lock:Acquired ObjectID
- Lock:Acquired IsSystem
- Lock:Acquired Mode
- Lock:Acquired BigintData1
- Lock:Acquired IntegerData2
- Lock:Acquired ObjectID2
- Lock:Acquired Type
- Lock:Acquired OwnerID
This gave me the advantage to have a valid test for all Extended Event Targets that are provided (only ETW-Tracing was left out) – specifically histogram and Pair Matching (I did not care about the few occasions of lock escalation on purpose).
The following Trace technologies and -Targets were used:
- XEvent Trace, Target: None
- XEvent Trace, Target: Ring Buffer
- XEvent Trace, Target: File
- XEvent Trace, Target: Counter
- XEvent Trace, Target: Histogram
- Here I chose to filter on lock acquired and to bucketize on the lock mode
- XEvent Trace, Target: Pair Matching
- Guess, what I matched here 😉
- SQL Trace, Target: None (I had to trick a little bit to get this to work, but I made sure, the behavior of this unsupported configuration did not distort the results: It’s just a SQL Trace with no Provider processing anything, so all events are lost by nature.)
- SQL Trace, Target: File
- SQL Profiler, remotely
For each Extended Event Target I tested 4 variations, based on the session options:
- Single event loss
- No event loss
- Multiple event loss
- Single event loss with causality tracking on
All other options were using the defaults for these tests.

Picture: the 24 prepared traces
The Results
I measured the total time for the workload to take as well as batches per second and CPU time %.
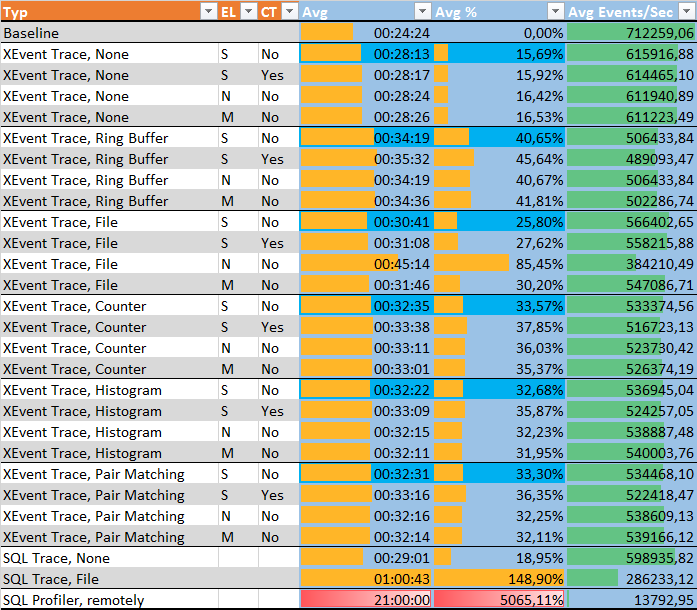
And here is the complete Table of Results:
EL = Event Loss. S = Single event loss, N = No event loss, M = Multiple event loss
CT = Causality Tracking On
For the sake of saving space and time, I will focus on the benchmarks with the options single event loss and no event loss without causality tracking. In fact, the cost of causality tracking was less than 1% for all targets.
So this is the more condensed result:
What we can tell from that is: (Remember: Everything is running under High CPU Load, so that’s the base of all results.)
- A plain XEvent Session itself, with no Targets, already does have a noticeable impact of ~15 % performance decrease.
- The overhead of the artificial (not supported) version plain SQL Trace, without the overhead of a rowset or file provider (aka target), is not too far off the Extended Events Session without the dispatching to any target (~19% versus ~15%).
- The Ring Buffer is the XE-Target with the greatest overhead (~40%). (!)
- The File-Target really does have the lowest overhead as expected, but it’s still 25%.
- The differences between the Targets Counter, Histogram and Pair Matching are irrelevant.
- Yes, even the simple Counter has a higher overhead than the File Target.
- Configuring the file target with no event loss adds approximately 4 times as much performance overhead.
- The difference for the other targets between single, multiple and even no event loss is mostly negligible in this scenario.
- Compared to Extended Events, the overhead through SQL Trace is almost “brutal”: It quadruplicated the total runtime.
- And there’s even more: Tracing with SQL Profiler is absolutely impossible for such a scenario: I filled in 21 hours, but that’s actually an estimate: I stopped those test circle after around 3 hours (forgive me, but it’s just a waste of time…), counted the finished events and calculated how much else it would have taken, roughly – in an actually rather optimistic manner. Profiler, as I always say, is a “no go” for tracing longer periods of time, especially if performance is already at stake.
You have a nice picture of the SQL Trace Architecture in BOL: msdn.microsoft.com/en-us/library/hh245121.aspx
The Extended Events Architecture is depicted here: msdn.microsoft.com/en-us/library/bb630318%28v=sql.105%29.aspx
Adding Filters
How does adding filters change the observer overhead?
Now it is important to note what I actually used as a filter: The database_id / source_database_id. – I essentially added a filter that would never return “true” by adding a filter on database_id = 77 – since no session/query/lock was on this non-existing database.
Why did I do that? – This is a totally artificial test/benchmark. I am interested what the pure overhead of tracing is, and not what happens if a certain percentage of activity is not logged. (That might be something for a different benchmark. :-))
This time I only focused on “single” and “no event loss”.
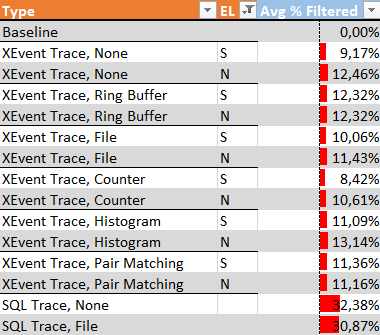
The results of Filtered Tracing, without actually storing/logging any events is as follows:
- As one can see, the overhead of the pure XEvent session without target drops from ~ 15% to 9% respectively ~ 16.5% vs. 12.5 % (no Event loss)
- The other targets do in fact show more differences in this setup:
- The Counter Target with single event loss benefits most of the filter and drops from ~33.5 to 8.4 % overhead.
- Only Ring Buffer and Pair Matching show no difference between single and no event loss.
- SQL Trace with and without rowset provider (file) as target have almost the same overhead – no surprise if you know the architecture. This is in fact another huge difference which counts for Extended Events, where filters get honored much sooner within the Trace.
- That the overhead of SQL Trace without target and at the same time all events being filtered out is actually higher than the overhead without target but no filtering (from the former test cycle) must be caused by the processing of for filtering out. I will not dive more into this though, since this setup is not documented and or supported. And in my eyes, “SQL trace is dead” anyways 😉 – okay, I am exaggerating a bit here, but I am also just being frank: For SQL Server 2012 there is almost no need to use it any more. – Running benchmarks using Distributed Replay is such a reason – isn’t that ironic?
I did not run SQL Profiler for this Test, forgive me. You probably know why by now. 😉
Wait-Types for Extended Events
Another aspect I was interested in were the specific XEvent wait-types which would occur when running Extended Event sessions. (Wait-Statistics are often the base for performance analysis)
In general, you will see the following:
When starting a session:
PREEMPTIVE_XE_TARGETINIT
PREEMPTIVE_XE_CALLBACKEXECUTE
PREEMPTIVE_XE_SESSIONCOMMIT
When stopping a session:
PREEMPTIVE_XE_SESSIONCOMMIT
XE_BUFFERMGR_ALLPROCESSED_EVENT PREEMPTIVE_XE_CALLBACKEXECUTE
While running sessions you will see:
XE_DISPATCHER_WAIT – From BOL: Occurs when a background thread that is used for Extended Events sessions is waiting for event buffers to process. – You should be able to safely ignore this unless you believe a problem is occurring with processing of events for async targets. Since this works on a queue you can have bursts of high wait times especially when no XEvent sessions are active.
XE_TIMER_EVENT – From BOL: Used to indicate a background task is waiting for “expired” timers for internal Xevent engine work. – You should be able to safely ignore this one. Just used by the Xevent engine for internal processing of its work. If something was possibly wrong with Xevent processing you might see if this thread ever “wakes up”
When starting the File target you will also see:
PREEMPTIVE_XE_TARGETINIT
If you run a session with the no event loss option you might see:
XE_BUFFERMGR_FREEBUF_EVENT – which by BOL means: An Extended Events session is configured for no event loss, and all buffers in the session are currently full. This can indicate that the buffers for an Extended Events session are too small, or should be partitioned.
So, I hope this was interesting for you. You may draw more and other conclusions out of these results. Remember though: this is a very specific scenario with no CPU reserves, so the Tracing/observer overhead has to show up – no choice but to take away (CPU) resources.
Happy Tracing
Andreas
P.S.: I just discovered that my MCM and SQLSkills-class buddy Steven Ormrod also has recently blogged about the performance overhead from a SQL Trace to remote file share on production here: stevenormrod.com/2013/06/remote-trace-slowing-down-server/


Leave a Reply
Want to join the discussion?Feel free to contribute!