How to import Extended Events session event_file target and parse deadlock-graph
This time it’s about one of the things that Extended Events do better and more easily than all techniques before: Saving of deadlock-events that occurred and analyzing the respective deadlock-graph.
Deadlocks, explained here, occur between at least 2 threads but often more than 2 are involved. – I am using the term “thread” on purpose, since process would not be sufficiently accurate. Mostly Deadlocks in fact do happen between different sessions/processes, but it is also possible that a process running with parallel threads blocks itself. The error number for deadlocks is “1205” – probably known to all SQL professionals.
For tracing deadlocks before SQL Server 2008 there were merely the following ways:
1. A SQL Trace with Profiler or without GUI with logging in a trace-file or live inside the GUI
2. Trace Flags 1204, 1205 or 1222, which log into SQL Server’s errorlog – „great“ especially on “eventful” servers.
Some may remember those horrible entries in the error log:

- Event Notifications which provide the data via Service Broker Queue in XML-format. Here you find an elaborate example with storing in table and automatic email with information about the Event.
- A WMI-Alert which also provides the data via XML und tied to a job can also log respectively inform about it.
All those approaches, as different as their respective advantages may, have one thing in common: They have to be set up. In case of doubt after the first deadlocks occurred.
But since SQL Server 2008 all deadlocks are being logged by default.
This is done by the automatically running system_health Extended Event session.
This, alongside deadlocks logs further important server events and error-information. Here you find details on it.
Since SQL Server 2012 the system_health session apart from the memory-target “ring_buffer” also logs into an event-file, so that deadlocks and other error stay available even after a server restart for quite a while (up to a few days) – until the rollover of the 5 files has occurred.
For SQL Server 2008 instances I recommend adding the file-target.
How can you read-out that data? This works quite easily via T-SQL once you know that this data is available via the DMV sys. dm_xe_session_targets. This is how you read-out the ring_buffer-Target.
SELECT
target_data
FROM
sys.dm_xe_session_targets AS dm_xe_session_targets
INNER JOIN sys.dm_xe_sessions AS dm_xe_sessions
ON dm_xe_session_targets.event_session_address = dm_xe_sessions.address
WHERE
dm_xe_sessions.name = ‘system_health’
AND target_name = ‘ring_buffer’
„Target_data“ is XML-text stored as unicode-text-blob which can even be opened directly in SSMS after converting to XML. To filter out only the deadlocks you need to use the XQuery-extensions of T-SQL. And this is how that looks like in code plus results:

When clicking at one of those Deadlock-Report reports in XML-format in SSMS it will be opened in a new window as XML-document:

– in the picture I collapsed some nodes for brevity.
Most important here are: the victim-list, which for a multi-victim-deadlock contains one process-id per victim, which again one can investigate more deeply in the process-list.
In the executionStack one can find the executes SQL-command and if applicable even the procedure name.
Below in the resource-list follows a list of all involved (blocked) resources.
All nodes are peppered with details such as row number, objectname, lock-mode, waiting time, spid and of course timestamps.
Who wants to start from here can of course take apart the XML further and try to break individual nodes relationally into columns. For that one has to first extract the deadlock-graph.
CAST(XEventData.XEvent.query(‘(data/value/deadlock)[1]’) AS xml) AS DeadlockGraph

From there one can easily parse the individual nodes. The transaction isolation level for example can be reached with the value-method once you know on which level/in which node in the graph it resides.
XMLCol.value(‘(/deadlock/process-list/process)[1]/@isolationlevel’, ‘varchar(100)’)
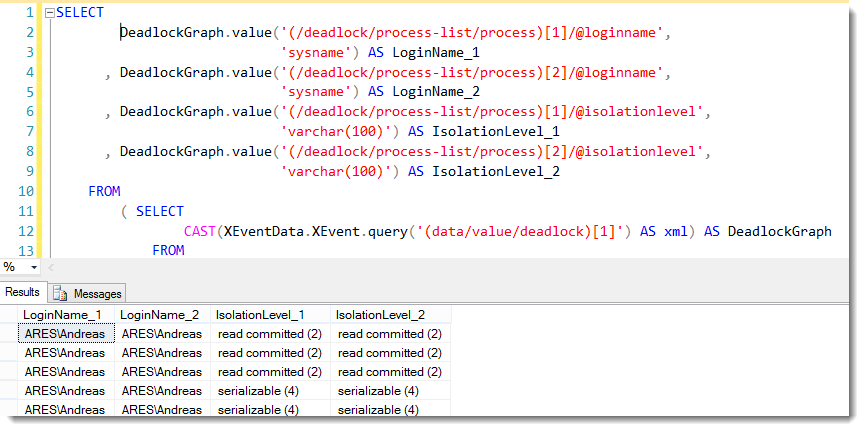
In this manner one can proceed with almost all attributes and elements. For locking-information one will get to the limits of the static relational representation since depending on the locked resource there will be completely different attributes.
The second problem arises once you are dealing with a multi-victim-deadlock.
Potentially there can be a vast number of locked and killed victim-processes, so that one can hardly prepare an ever sufficient schema.
Here an example of a multi-victim-deadlock, displayed with the XEvents GUI (Profiler could not handle that as many other things)

Last month I published my SQL Deadlock-Collector & Parser freely downloadable at codeplex. – here the direct link: : SQL Deadlock Collector & Parser
– here the article with detailed explanation:
free Deadlock-Collector & -Parser based on Extended Events
There I decided to always contrast the first two processes, which helps for most deadlocks a lot already. This is how it looks like:

How is it possible to read-in the eventfiles which are written to as well by the system_health-session?
For that the system-function sys.fn_xe_file_target_read_file is a provided. It needs the path to the xel-file and the name of the first file which is to be read-in. The files are located in the log-directory of the SQL Server instance by the way. If the filename is not specified all files in the directory will be read-in. What makes the function really handy is that one can already arm the path with a wildcard so that practically one does not even need the filename any more.
This is how that can look like:

Those who are already using the Deadlock-Collector to parse and save ones deadlocks can also use it to import deadlocks from any systems into the SQL_Analysis_Data-database.
For that simply use the procedure Locking.ins_DeadLock in the database SQL_Analysis_Code with the parameter @XESource.
It is set to use the ring_buffer by default. But one can simply pass in the path + filename of the xel-file to import:
USE SQL_Analysis_Code;
DECLARE @DeadlocksCollected int;
EXECUTE Locking.ins_DeadLock
@XESource = ‘D:LogFilesSQLServerSQL2012Devsystem_health_*.xel’
, @DeadlocksCollected = @DeadlocksCollected OUTPUT;
SELECT @DeadlocksCollected AS [Number of new Deadlocks collected:];

Afterwards one can comfortably analyze the deadlocks via views or ad-hoc T-SQL in a half-way relational structure as described here.
Note:
It is possible that deadlocks occur which do not appear in the system_health-session targets. Neither in the ring_buffer nor in the filetarget. This happens when the deadlock-graph is too big for the buffer-memory.
In order to make sure that larger deadlock graphs are also captured, I recommend increasing the maximal work memory of the system_health session.
And those who are still using Profiler & SQL trace now (deprecated since SQL Server 2012 for good reasons), here’s a tip: This is how a multi-victim-deadlock looks in Profiler:

Looks more like a „multi-winner-deadlock” 😉
And this is how the XEvents GUI displays it:

HappyXEvent Parsing
Andreas
[insert_php]
the_tags( ‘Tags: ‘ , ‘ – ‘ , ‘ ‘ );
[/insert_php]
[insert_php]
echo’Categories: ‘; the_category( ‘ – ‘ );
[/insert_php]

Leave a Reply
Want to join the discussion?Feel free to contribute!