Where is that Preemptive Wait coming from?
Database Ownership and Performance: a journey through SQL Server internals with XEvents, Windbg and Wireshark
In this article I will bring together several techniques for troubleshooting a performance- and security-related “phenomenon” I recently noticed when doing some tests with Natively Compiled Stored Procedures.
Background: In SQL Server 2014, Natively Compiled Stored Procedures did not support EXECUTE AS CALLER but EXECUTE AS “SpecificUser” was required. This user could be specified with “Username”, “Self” or simply “Owner” – in which case the owner of the procedure usually reverts to the schema owner, which mostly reverts to the Database Owner altogether.
The phenomenon I encountered was that I noticed some pretty strange long execution times when running a workload consisting of a very basic stored procedure that does nothing more than insert one row of data into a small, unspectacular table.
The insert itself should run less than a second for 1000 rows, but I could see up to 5 seconds. The body of the procedure looks like this:

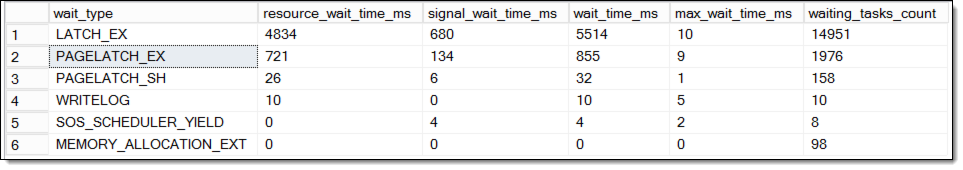
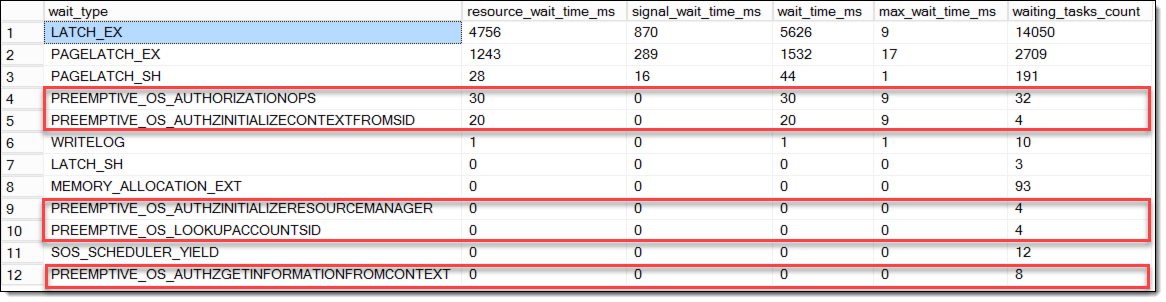
The analysis: Since neither the query plan nor “Show Statistics ON” showed anything unusual, I took a step back and started a top-down-analysis with the Waits and Queues Methodology (which, if you are new in this area, has been a proven methodology for performance analysis for over a decade and is explained for SQL Server probably for the first time in detail here: SQL Server 2005 Performance Tuning using the Waits and Queues) Using the new session-level waits-DMV in SQL Server 2016 (sys.dm_exec_session_wait_stats), I saw the following distribution of waits:


From this list, Latch-contention, blocking and some waiting for IO is to be expected with a very concurrent workload (50 threads trying to insert on the last page). The wait-types marked red are the ones that caught my attention. As Preemptive waits are a quite different beast, and I initially thought maybe there was some authentication issue with the client, I decided to take a look at the CMEMTHREAD.
The CMEMTHREAD is an indicator that many threads are contending simultaneously for a thread-safe memory object. Now since we are running a highly concurrent workload, I could just leave it at that, but remember: “Never make quick decisions by confusing symptom with cause”. Keep looking for the real cause. (A good article by Paul Randal on exactly this issue: “Avoiding Knee-Jerk Performance Troubleshooting”)
So, the question is, which memory object is so special here.
Time for Extended Events One of the niftiest features of extended events is that you can get a full stack dump of just a single thread, using the Action “sqlserver.create_dump_single_thread”. Similarly, using “package0.callstack” you can get a callstack of the last 16 frames. You can analyze the outcome with Windbg. – Or, using Trace Flag 3656, you can even query the Extended Event targets directly with XQuery from within Management Studio and the callstack will be materialized, provided you have loaded the correct symbols. (Nothing you should do on a production Server!) (An example how to do that can be found here: Resolving DTC Related Waits and Tuning Scalability of DTC)
With the dump opened in Windbg the following function calls inside the SQL Server engine can be seen:

The Stack dump rings a bell. Right before allocating the memory (CMemThread::Alloc (red), several functions with very familiar names were called (orange):
sqllang!CWindowsSecurityPrimaryInfo::GetNtGroupsViaAuthZ
sqllang!CreateLoginToken
sqllang!CreateLoginTokenForImpersonation
And those in turn must have been caused by the sqllang!CAutoExecuteAsContext::Set, sqllang!CMsqlExecContext::FExecute and so on (green). At this point I pretty much knew where to look. But just to show you an example of how this can be done without even touching Windbg, here is an (accumulated and commented) result from the Extended Event callstack-Action:

This callstack results from the PREEMPTIVE_OS_LOOKUPACCOUNTSID Wait-Type, which I noticed would happen exactly once per procedure call. When analyzing different callstacks together I could draw the conclusion that the following function calls lead to the respective Wait-Types:
sqllang.dll!LookupAccountNameInternal -> PREEMPTIVE_OS_LOOKUPACCOUNTSID
sqllang.dll!CWindowsSecurityPrimaryInfo::GetNtGroupsViaAuthZ -> PREEMPTIVE_OS_AUTHZINITIALIZERESOURCEMANAGER
sqllang.dll!CWindowsSecurityPrimaryInfo::Init -> PREEMPTIVE_OS_AUTHORIZATIONOPS
The Preemptive Waits read from the Extended Events file-target can be ordered in their occurrence (from top to bottom), leading to the following picture:

The hereunreadable callstack for the call to AUTHORIZATIONOPS (undocumented) at the bottom.
First outcome:
From those calls one can deduct that not the client is authenticating at SQL Server, but actually the procedure call itself causes Windows API calls (LOOKUPACCOUNTSID, AUTHZINITIALIZERESOURCEMANAGER) for authentication purposes. Now at the very latest it’s time to check the ownership-chain for the stored procedure. So I checked the header of the proc, and indeed, just as I expected it contained a “WITH EXECUTE AS OWNER”. That alone can’t be it, so the question is, who is the owner. I already suspected it and there it was: The database was owned by a LOCAL Windows account. Now, that is rare, but it all makes sense now: For every execution of the procedure, the ownership had to be verified – and since it is a Windows-Account, it had to go out of SQL Server OS, using a Preemptive call to Windows, wait, and continue only after Windows returns control of this thread back to SQL Server.
Testing the improvement options: Now, obviously, I did not stop here but rather made some more tests. Based on the fact that there are possible types of owner for objects within SQL Server, I compared the execution times (and waits) between those 3 possible Database owner-types:
- SQL Account
- Windows DomainAccount
- Local Windows Account
– I did also test with Admin vs. non-Admin and NTLM vs. Kerberos but saw no difference.
So here is the result of the Performance-Comparison with different Database-/Procedure-Owners:

Interpretation:
- The obvious: Using a local Windows Account results in a huge performance-penalty for such a simple INSERT-statement
- Using a Domain Account I could notice that every 10 minutes the next execution would be a bit slower.
Further analysis
When checking the Wait-stats again, I could see that usually the Windows-Domain-Account had the following simple waits:
Pretty ok and nothing to worry about. But the first call after 10 minutes would always result in the same wait-types as I observed for the local Windows Account, except that the wait-times are much much lower. (You can compare the below picture with the one from the beginning of the article.)
Behind the Scenes: Network Tracing
To explain the difference, I ran a Network Trace using Wireshark And exactly every 10 minutes I saw some additional KERBEROS-traffic going to the Domain Controller. Below you see the opened data frame with the Request for a Ticket Granting Service Ticket (TGS-REQ).

Background infos:
As the User, on whose behalf the service requests the service ticket, is identified using the user name and user realm/domain (SQL\SQLDBOwner in my case), the padata type PA-FOR-USER is used, as you can see in the screenshot. You can even see the Checksum added for protection.
The S4U2self extension of the PA-DATA structure allows a service to obtain a service ticket to itself on behalf of a user. The user is identified to the KDC using the user’s name and realm.
Luckily the DC answers right away with a TGS-REP, containing the PA-DATA-structure with ticket for the service that was named in the TGS-REQ from above:

There is plenty literature available if you want to learn more about the Kerberos Protocol-Elements. Here is a documentation from Microsoft:
Kerberos Protocol Extensions: Service for User and Constrained Delegation Protocol
The 10-minutes puzzle: 1) After doing some extensive testing, I conclude that the 10-minute interval after which a new Ticket Granting Service Ticket-Request is initiated must be a SQL Server specific enhancement for Domain Accounts to avoid making this round trip for every SID-validation. The 10 minutes are consistent and independent from other workload influencers. The cause behind is not documented.
2) The much faster validation for the AD-Account is very fast thanks to some caching in Windows. (Thank you, Jack Richins from formerly SQL Security Team, for reminding me of this)
3) For the local Windows Account, there is no such performance improvement via caching which results in much slower response times.
Final results and learnings:
- Using local users for SQL Server can create noticeable impact for short transactions. Yet another reason to stay away from local accounts.
- For the SQL Account, naturally no Windows calls are necessary at all, but the performance-advantage compared to the AD-Account is marginal, even for high-speed scenarios.
- Network latency matters even between SQL Server and DC. Not just for the initial Login-phase but even for ongoing validations from within SQL-statements.
I can stick to my recommendation for Database Ownerships (SQL Server Database Ownership: survey results & recommendations) 🙂
I hope you found this an interesting read.
Andreas
PS: for the geeks among you:
The Stack Dump in Text format together with some comments:
Child-SP RetAddr Call Site
000000e9`2f0b79d8 00007ffe`f9e51118 ntdll!NtWaitForSingleObject+0xa
-> this function is actually deprecated (Hello, Microsoft?)
000000e9`2f0b79e0 00007ff7`04999fef KERNELBASE!WaitForSingleObjectEx+0x94
000000e9`2f0b7a80 00007ff7`04999d7d sqlservr!CDmpDump::DumpInternal+0x22f
000000e9`2f0b7b20 00007ff7`049a15b8 sqlservr!CDmpDump::DumpFilter+0xcd
000000e9`2f0b7c10 00007ffe`ef0ef2cb sqlservr!memset+0x1819
000000e9`2f0b7c40 00007ffe`fc98398d msvcr120!__C_specific_handler+0x93 [f:\dd\vctools\crt\crtw32\misc\amd64\chandler.c @ 162]
000000e9`2f0b7cb0 00007ffe`fc9493a7 ntdll!RtlpExecuteHandlerForException+0xd
000000e9`2f0b7ce0 00007ffe`fc948fbd ntdll!RtlDispatchException+0x197
000000e9`2f0b83b0 00007ffe`f9e58b9c ntdll!RtlRaiseException+0x18d
000000e9`2f0b8b70 00007ff7`04999c9c KERNELBASE!RaiseException+0x68
000000e9`2f0b8c50 00007ffe`f05602c6 sqlservr!CDmpDump::Dump+0x4c
000000e9`2f0b8c90 00007ffe`f105c411 sqllang!SQLDumperLibraryInvoke+0x1f6
000000e9`2f0b8cd0 00007ffe`f105ce94 sqllang!SQLLangDumperLibraryInvoke+0x161
000000e9`2f0b8d80 00007ffe`f102cd0b sqllang!CImageHelper::DoMiniDump+0x475
000000e9`2f0b8f90 00007ffe`f072e9c4 sqllang!stackTrace+0x9db
000000e9`2f0ba9b0 00007ffe`f072f6ae sqllang!XeSqlPkg::IsSystem+0x174
000000e9`2f0bab90 00007ffe`ef2e779a sqllang!XeSqlPkg::CreateDumpSingleThreadActionInvoke+0x1e
-> you can clearly see how this stack dump was created: XEvents
000000e9`2f0babc0 00007ffe`ef2a1b8e sqldk!XeSosPkg::wait_info_external::Publish+0x1a9
-> Now we will see our wait-type when we ask the DMVs or XEvents
000000e9`2f0bac20 00007ffe`ef2a63a4 sqldk!SOS_Scheduler::UpdateWaitTimeStats+0x596
000000e9`2f0bb530 00007ffe`f0d94fac sqldk!SOS_Task::PopWait+0xba
000000e9`2f0bb590 00007ffe`f0d9481e sqllang!CWindowsSecurityPrimaryInfo::GetNtGroupsViaAuthZ+0x75c
-> this will lead to the Preemptive Wait: PREEMPTIVE_OS_AUTHZINITIALIZERESOURCEMANAGER
000000e9`2f0bb890 00007ffe`f0d956ed sqllang!CWindowsSecurityPrimaryInfo::Init+0x2ce
000000e9`2f0bba00 00007ffe`f041a88b sqllang!GetWindowsSecurityPrimaryInfo+0xbe
000000e9`2f0bba60 00007ffe`f041cadb sqllang!CreateLoginToken+0x2d7
000000e9`2f0bbc50 00007ffe`f041dca8 sqllang!CreateLoginTokenForImpersonation+0xcb2
-> an Impersonation is happening (EXECUTE AS)
000000e9`2f0bc400 00007ffe`f0358342 sqllang!CAutoExecuteAsContext::Set+0xe2d
000000e9`2f0bc680 00007ffe`f001245e sqllang!CSECExecAsRuntimeServices::_Set+0x424
000000e9`2f0bc900 00007ffe`f0012041 sqllang!CMsqlExecContext::FExecute+0x336
000000e9`2f0bcc30 00007ffe`f0d1d83d sqllang!CSQLSource::Execute+0x983
000000e9`2f0bcdd0 00007ffe`f0d1d241 sqllang!CStmtExecProc::XretLocalExec+0x26e
000000e9`2f0bce50 00007ffe`f0d19f98 sqllang!CStmtExecProc::XretExecExecute+0x481
000000e9`2f0bd600 00007ffe`f00119ca sqllang!CXStmtExecProc::XretExecute+0x38
000000e9`2f0bd640 00007ffe`f0012933 sqllang!CMsqlExecContext::ExecuteStmts<1,1>+0x40d
000000e9`2f0bd780 00007ffe`f0012041 sqllang!CMsqlExecContext::FExecute+0xa9e
000000e9`2f0bdab0 00007ffe`f0cd3f6d sqllang!CSQLSource::Execute+0x983
000000e9`2f0bdc50 00007ffe`f0ce0e6c sqllang!ExecuteSql+0x93d
000000e9`2f0be7d0 00007ffe`f0ce1549 sqllang!CSpecProc::ExecuteSpecial+0x15c
000000e9`2f0be8d0 00007ffe`f001a82b sqllang!CSpecProc::Execute+0x299
000000e9`2f0bea00 00007ffe`f0021542 sqllang!process_request+0xe61
000000e9`2f0befd0 00007ffe`f00210a3 sqllang!process_commands_internal+0x2df
000000e9`2f0bf050 00007ffe`ef2a5bfd sqllang!process_messages+0x253
000000e9`2f0bf260 00007ffe`ef2a58f5 sqldk!SOS_Task::Param::Execute+0x231
000000e9`2f0bf860 00007ffe`ef2a554d sqldk!SOS_Scheduler::RunTask+0xaa
000000e9`2f0bf8d0 00007ffe`ef2cd7c8 sqldk!SOS_Scheduler::ProcessTasks+0x3cd
000000e9`2f0bf9b0 00007ffe`ef2cdb10 sqldk!SchedulerManager::WorkerEntryPoint+0x2a1
000000e9`2f0bfa80 00007ffe`ef2cdcd7 sqldk!SystemThread::RunWorker+0x8f
000000e9`2f0bfab0 00007ffe`ef2cd9f8 sqldk!SystemThreadDispatcher::ProcessWorker+0x2de
000000e9`2f0bfb60 00007ffe`fc6e13d2 sqldk!SchedulerManager::ThreadEntryPoint+0x1d8
000000e9`2f0bfc10 00007ffe`fc9603c4 kernel32!BaseThreadInitThunk+0x22
000000e9`2f0bfc40 00000000`00000000 ntdll!RtlUserThreadStart+0x34
EOF

Superb !!